Platform Analysis
11 Jun 2021 - Eloy Chang
Recently in my master classes a teacher talk about platforms behaviour related to markets, and a important concept was the critical mass, this is, when a platform users growth is stronger by networks effects than from the efforts of growth made by the company, this means, users join, or uses, the platform by their own free will or because other people use the platform instead as a effect of a advertising or call to action made by the company.
This effect makes this critical mass an important value for every platform, but, the question is, how to calculate it? And there are a lot of factors involved that make it very difficult to calculate it, so, in this post I’m just trying to estimate it by simulations.
Platforms behaviours
Platforms, by definition, are interfaces that connect two sides of a transaction, a seller with a buyer (e-commerce), or companies that want to run an ads campaign with the people that will be reached by those campaigns (social networks) are some common examples. This definition divide the users database of a platform in two sides, and these sides trend to have differents growth behaviours:
-
A side may grow based on the amount of users in the same side of the platform, the most common example is a social network platform, users trend to join a social network if their contacts are in it.
-
Or a side may grow based on the amount of users on the other side of the platform, which is the e-commerce example, a buyer will look first in a platform where it is more secure to find a lot of options.
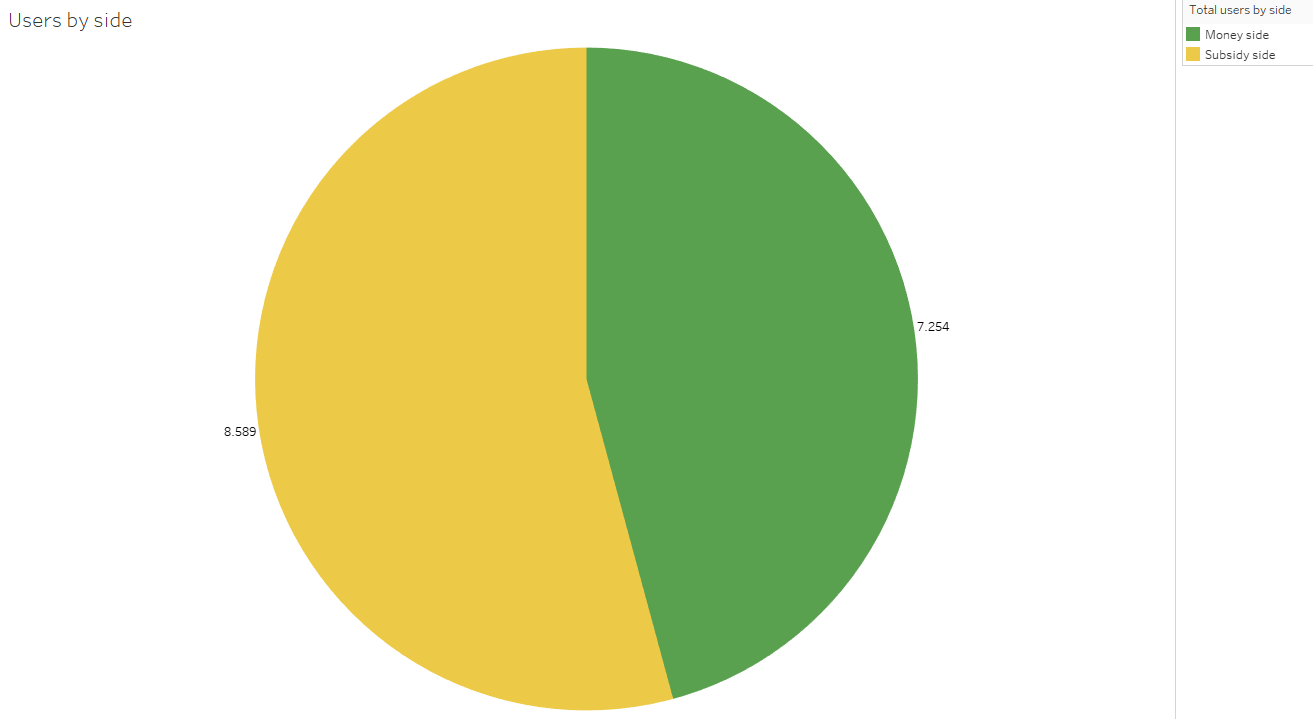
Taking this into account, the way the platform monetizes each side is very different, one of the sides will be the money side, the side which the platform is going to charge for using it, and a subsidy side, which will have a lower charge, will be free or even, in some cases, could be paid to use the platform.
The analysis
To estimate the critical mass I use historical data with the total number of users on both sides as well as the new users on each side by both, campaigns methods and by network influence, another data is the amount of money used in campaigns for both sides.
I also created a campaign_control object that simulates the decisions of how much to invest in campaigns for each side, (in the first stage of the project it just returns for each period the last amount invested plus a random value between -10% and 10% of it).
The simulator object read the data from a file, and train 4 machine learning models: A linear regression to estimate the network influence on each side based on the total users of some (or both) sides. A random forest model to estimate the new users obtained by paid campaigns.
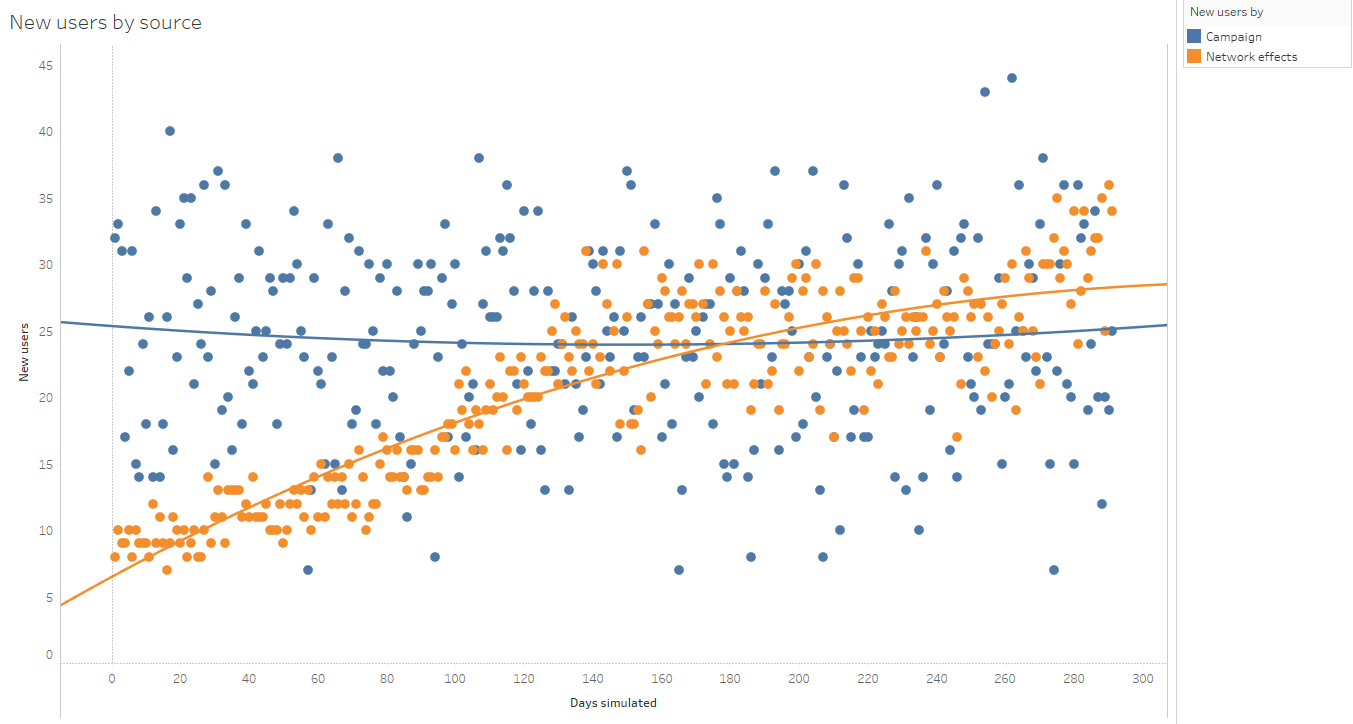
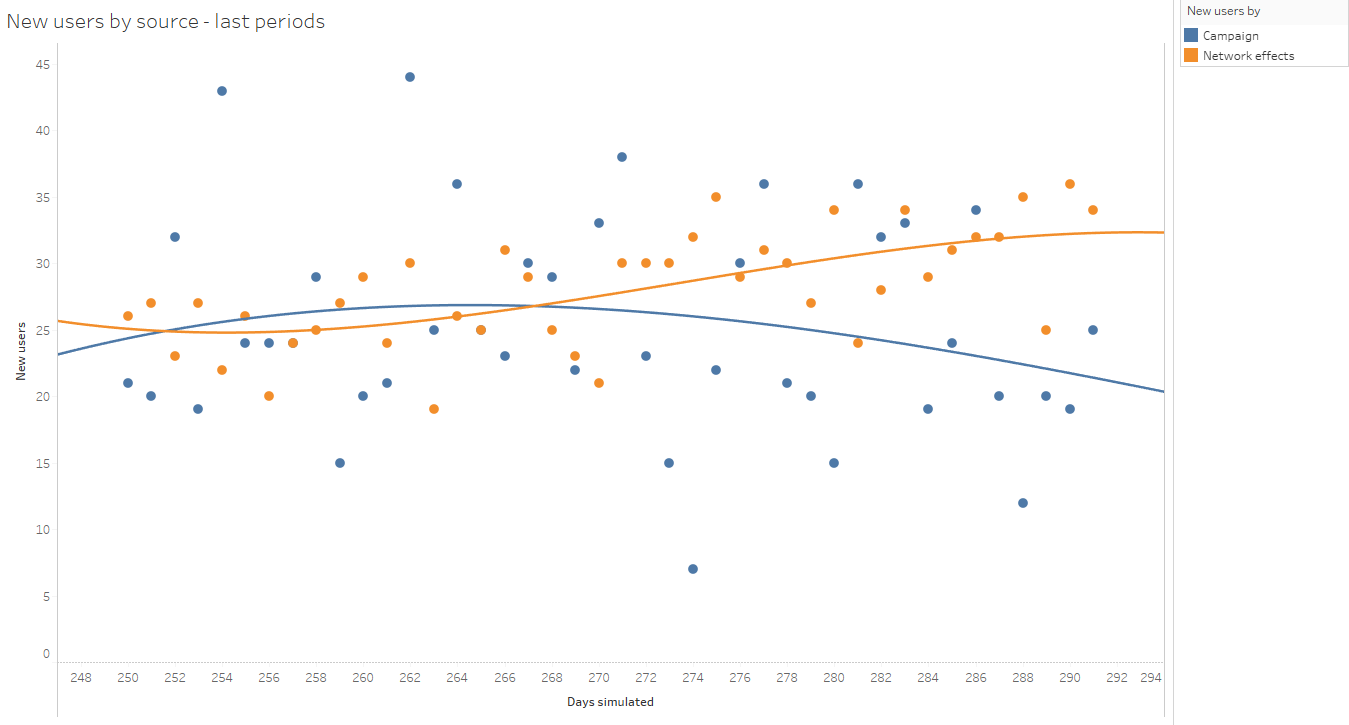
Then each period is simulated using those models, and evaluate if the new users obtained by network influence is greater than the users obtained by campaign influence. Finally I run the simulation for each period, ending it when the number of new users by network effects are greater than the new users gained by paid campaigns efforts in 5 consecutive periods, or after being simulated 1000 periods.
In the test, the critical mass was successfully reached at the 291 period with a total of 15.843 users.
Checkout some results and the source code on my github account